SRS Medical is proud to announce the launch of the PFS Score®.
The PFS Score is a proprietary algorithm that unfolds the results of Pressure Flow Studies (PFS) into a user-friendly interface, providing valuable data to physicians and patients. The PFS Score can be calculated for both catheterized studies and UroCuff-DC studies.
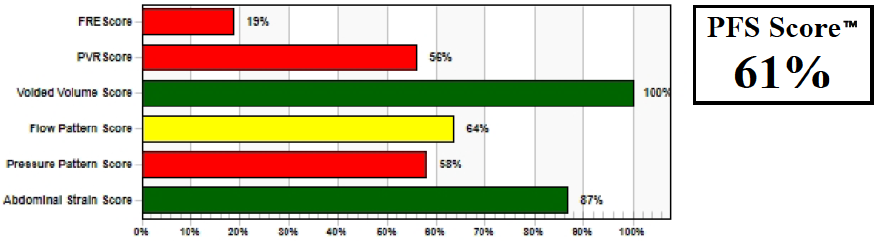
The PFS Score is comprised by six sub-scores, and provides an overall picture of the patient’s bladder function. Its 6 elements are:
- Flow Rate Efficiency Score
- Voided Volume Score
- PVR Score
- Flow Pattern Score
- Pressure Pattern Score
- Abdominal Straining Score
The sub-scores provide urologists with granular data for enhanced clinical decision-making and increase patient engagement.
If you have a CT3000 Pro (UroCuff Test hardware), please contact our technical support team or your local representative for a complimentary software update and start using the PFS Score.
PFS Score® FAQ
1. What is the PFS Score?
The PFS Score is a patent-pending proprietary process control algorithm to quantify the results of Pressure Flow Studies (PFS). The PFS Score can be applied to both catheterized PFS and UroCuff-DC PFS.
2. Why was the PFS Score Developed?
The PFS Score was developed to provide a summary of the salient data collected during a PFS study. It summarizes six attributes of the PFS data into a single score, with six sub-scores.
3. How does the PFS Score relate to the ICS/Newcastle Nomogram?
The Nomogram describes the peak pressure-flow relationship of a PFS study. The nomogram data represents one of the six sub-scores.
4. What are the six sub-scores that comprise the PFS Score?
- Flow Rate Efficiency Score
- Voided Volume Score
- PVR Score
- Flow Pattern Score
- Pressure Pattern Score
- Abdominal Straining Score
5. Are all six sub-scores weighted the same in the PFS Score?
No, there are three tiers of approximate weighting:
Most Weighted:
• Flow Rate Efficiency Score
• Voided Volume Score
• PVR Score
Moderately Weighted:
• Flow Pattern Score
• Pressure Pattern Score
Least Weighted:
• Abdominal Straining Score
6. What happens if one or more of the sub-score data is not available for a study?
There are two optional datasets for a PFS study (PVR and Abdominal Straining). If one or both of these measures are not recorded, the PFS Score calculates based on the other available data without penalty and the uncollected sub-score is reported as N/A.
7. What scale is the PFS Score and how was the scale established?
The PFS Score and each of the sub-scores are presented on a scale of 0%-100%, with 100% as a clinically optimal score. The scale was established through a combination of: (a) a review of peer-reviewed clinical literature, (b) expert clinical opinion, and (c) a review of many thousands of PFS studies performed on male LUTS patients.
8. For the male LUTS patients tested, does the data show the identical population distributions for each of the sub-scores?
No, we have analyzed a large set of PFS studies and have found that, on a population basis, male LUTS patients presenting for PFS testing do not arrive in the same “state of impairment” on all six sub-scores. For instance, we have found that, on a population basis, male LUTS patients arrive with a higher degree of obstruction (resulting in lower Flow Rate Efficiency Scores) than the clinical equivalent of PVR (resulting in relatively higher PVR Scores).
9. How do I display PFS Score on my UroCuff-DC reports?
The PFS Score and the six sub-scores can optionally be displayed at the bottom of page 1 of the UroCuff-DC report. By default, the PFS Score display is on. To change the setting at anytime, choose Configure/Instrument Settings and select from one of the three PFS Score display options. If you choose to change the display option for PFS Score on your study reports, you can always go back to any previous PFS study and reprint the report.
10. What is the general overview of each of the six sub-scores?
a. Flow Rate Efficiency Score (FRE Score) is a representation of the pressure flow relationship on the nomogram. FRE is a urodynamics statistic that represents the amount of flow for each unit of pressure applied.
b. Voided Volume Score is simply a score of the voided volume recorded during a void, with a voided volume of 300-500ml being clinically optimal and scoring falling off at both lower and higher values.
c. PVR Score is a score that both evaluates PVR as an absolute value, as well as evaluates PVR as percentage of bladder capacity (PVR / (PVR + VV)). PVR of < 50 ml and a PVR as a percentage of bladder capacity of < 10% being clinically optimal.
d. Flow Pattern Score evaluates several facets of the urine flow pattern including void time, hesitancy, time to peak, and peak flow rate.
e. Pressure Pattern Score evaluates the pressure pattern including peak pressure value.
f. Abdominal Straining Score evaluates the amount of abdominal straining that occurs during the void by comparing the minimum Abdominal EMG value to other Abdominal EMG parameters collected during the PFS.
Better Answers
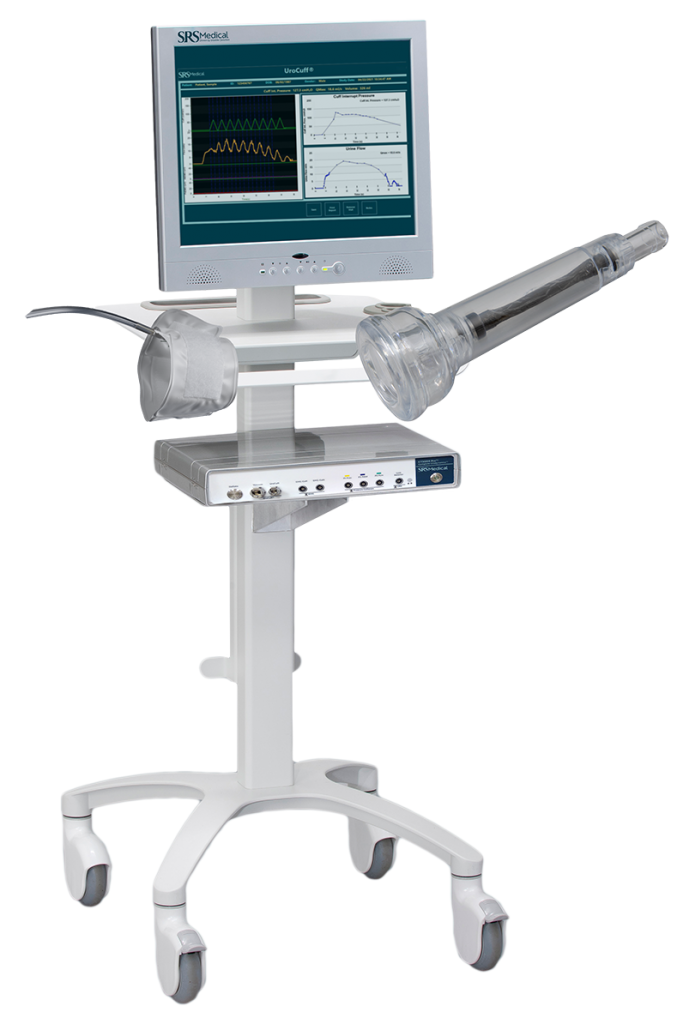
The UroCuff Test measures bladder function during voiding and provides important insights to optimize BPH care.
It offers your practice a LUTS patient management platform providing better clinical outcomes and greater efficiency.